|
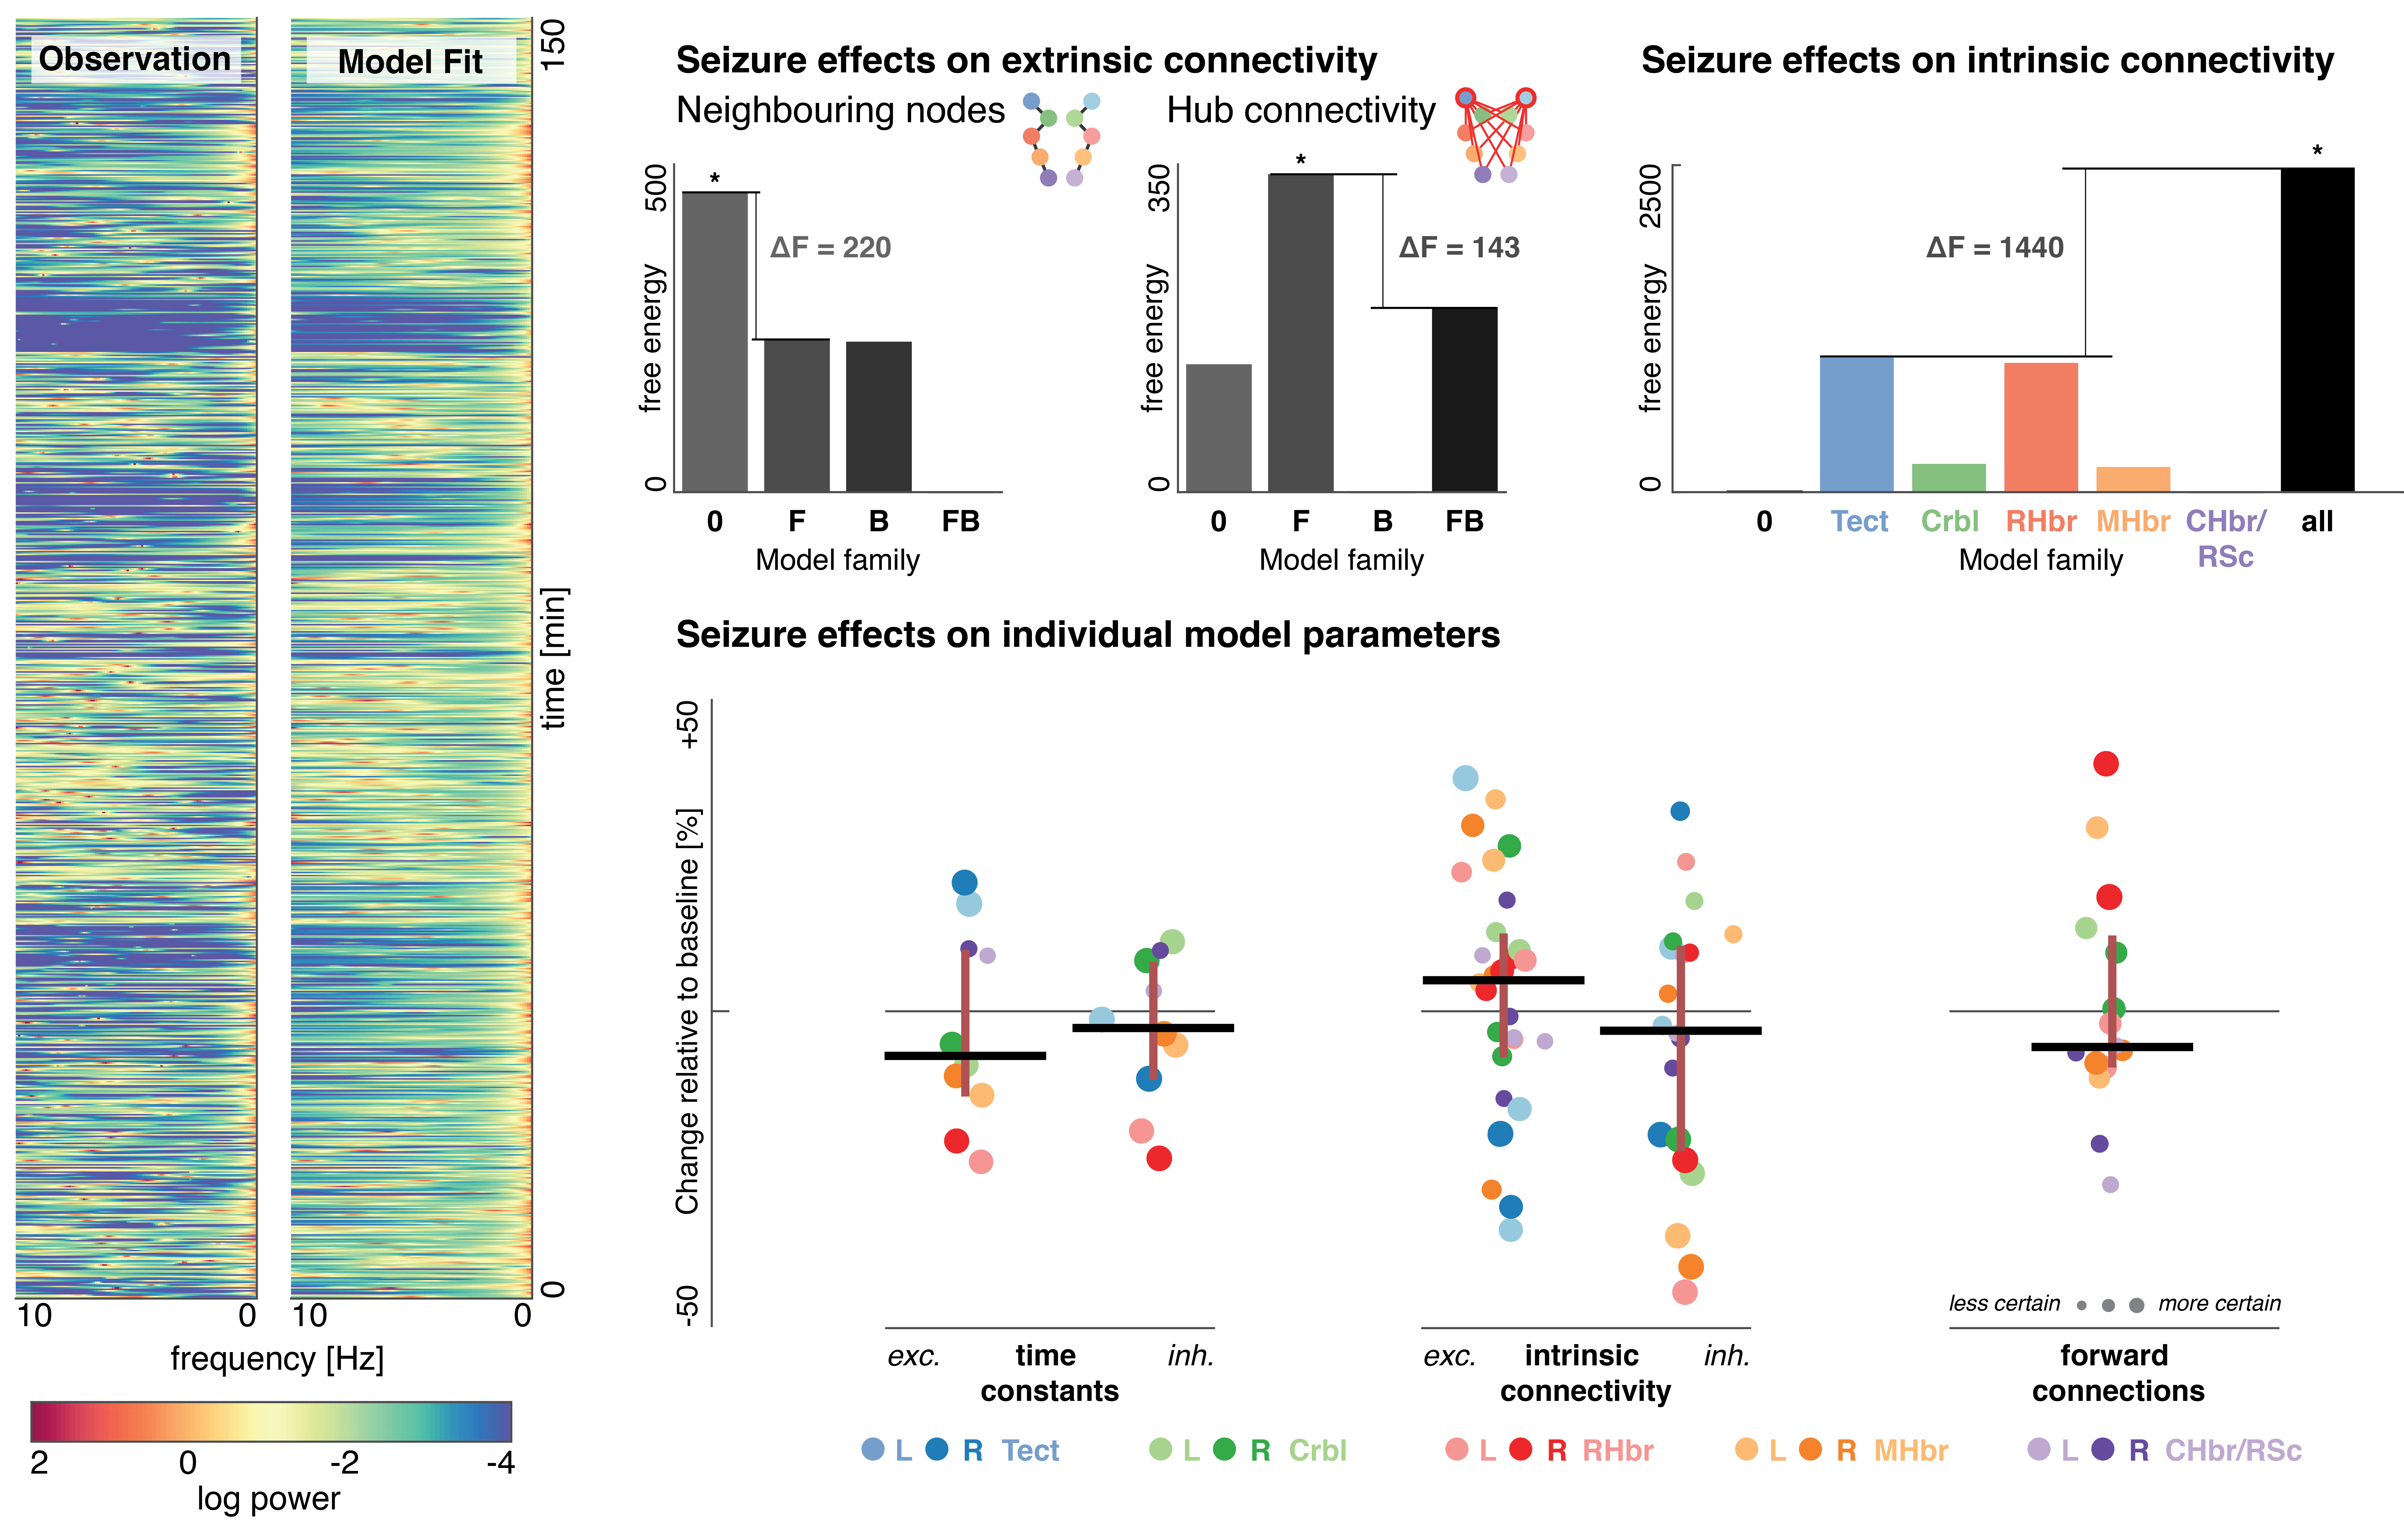
[Left] Each time window is fitted individually with a biophysical network model of coupled neuronal oscillators. Shown here is an example of the model fits for a single fish (time-frequency plot, with colours indicating log-power) [Top Row] We compared models that explain the seizures with changes in different groups of parameters. This Bayesian model comparison is shown separately for combinations of intrinsic (i.e. within source) and extrinsic (i.e. between source) coupling. |
[Bottom Row] From the winning model, parameter estimates are plotted at the time point when the maximum effect for PTZ is expected. This shows regionally varied changes in coupling parameters. Time constants are reduced (faster) for both excitatory and inhibitory neuronal populations; whilst intrinsic connections are overal increased for excitation, and decreased for inhibition. Connections to the hub region (i.e. tectum) are overall reduced. |