|
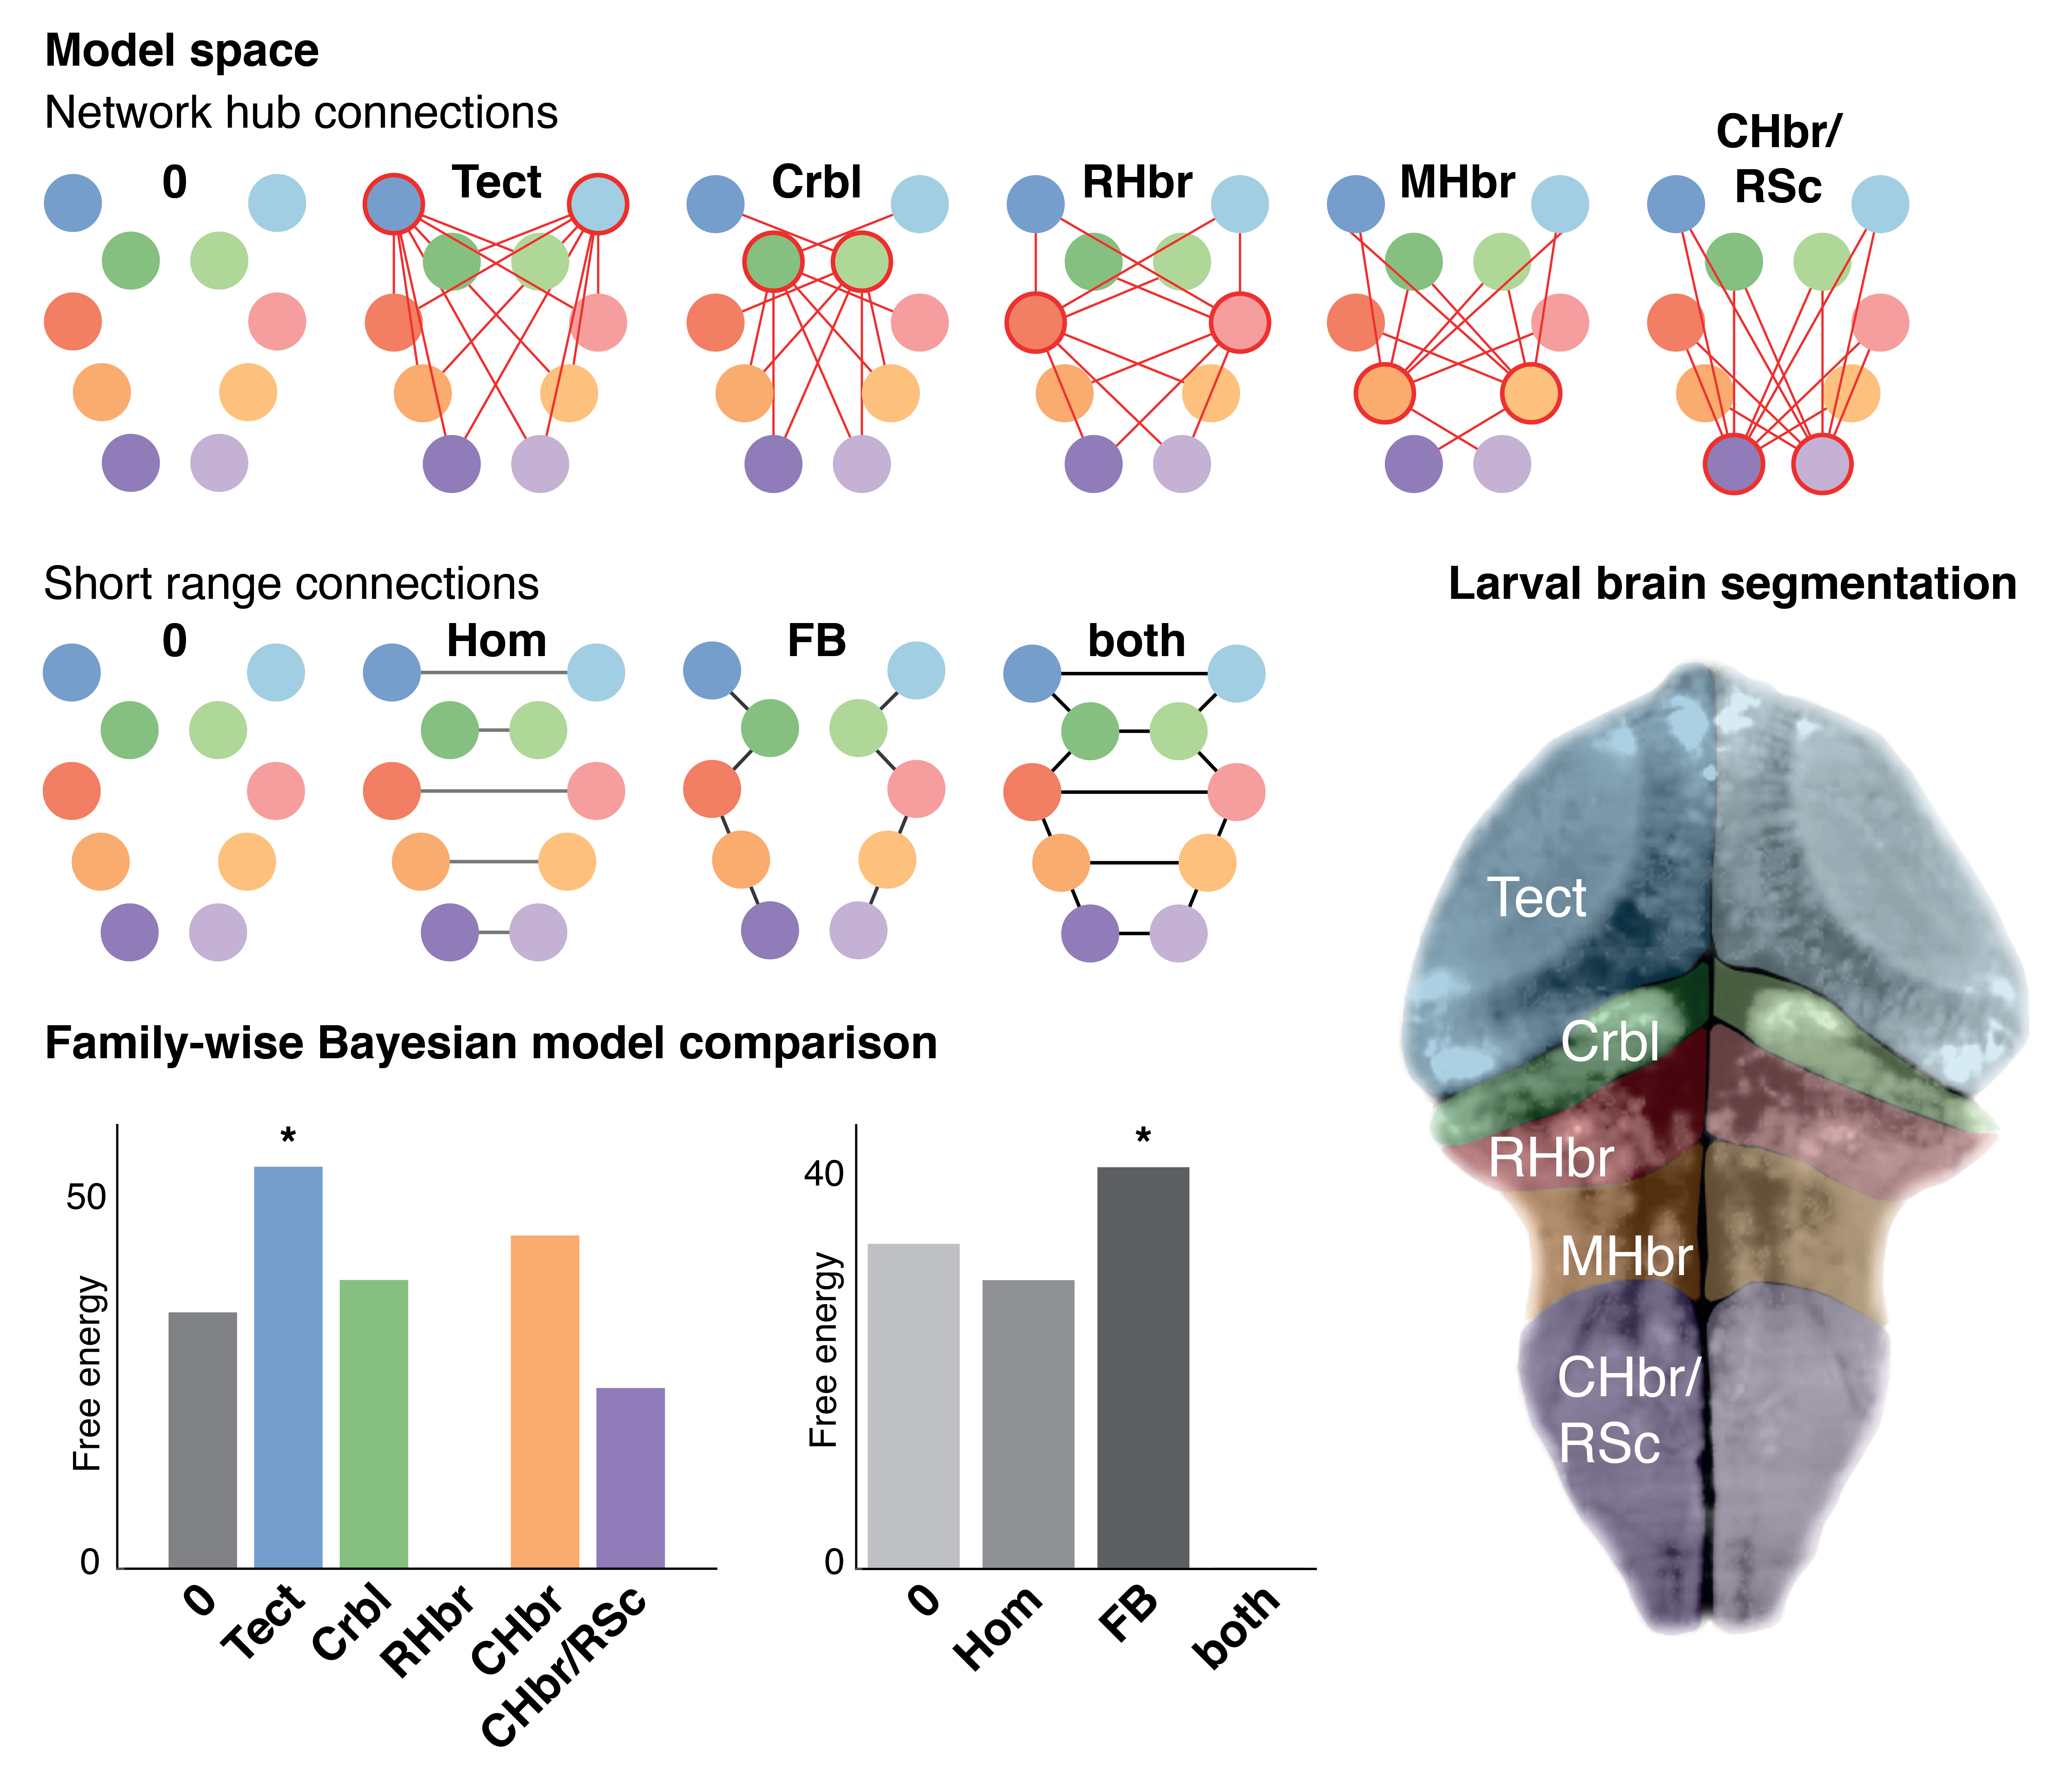
[Top Left] In this analysis, activity is represented as arising from a distributed network of 6 sources. These are couples according to specific network architecture hypotheses illustrated here. [Bottom Left] These graphs show the evidence for specific network architectures derived from a dynamic causal modelling (DCM) analysis on baseline data. The model architecture with the highest evidence is the basis for subsequent analysis. |
[Centre] A single slice of the intact larval zebrafish brain was imaged using a light sheet microscopy setup. It was divided into anatomically defined regions corresponding to the network nodes used in the model space.
[Bottom Right] Dynamic changes in fluorescence (ΔF/F, orange) are superimposed on the baseline image. These show synchronised and sustained bursts of activity during epileptic seizures.
|