|
[Left] Parameters estimated for individual time windows are plotted onto a reduced parameter space made up by time constant and intrinsic connection changes in a single brain region (optic tectum). Colours of the dots indicate time (blue-early, red-late time windows). Background colour indicates the predicted low-frequency power at that position in parameter space.
[Top Right] On hovering over the trajectories, predicted broadband (1-100Hz) neuronal spectra are plotted in comparison to the baseline average estimate. |
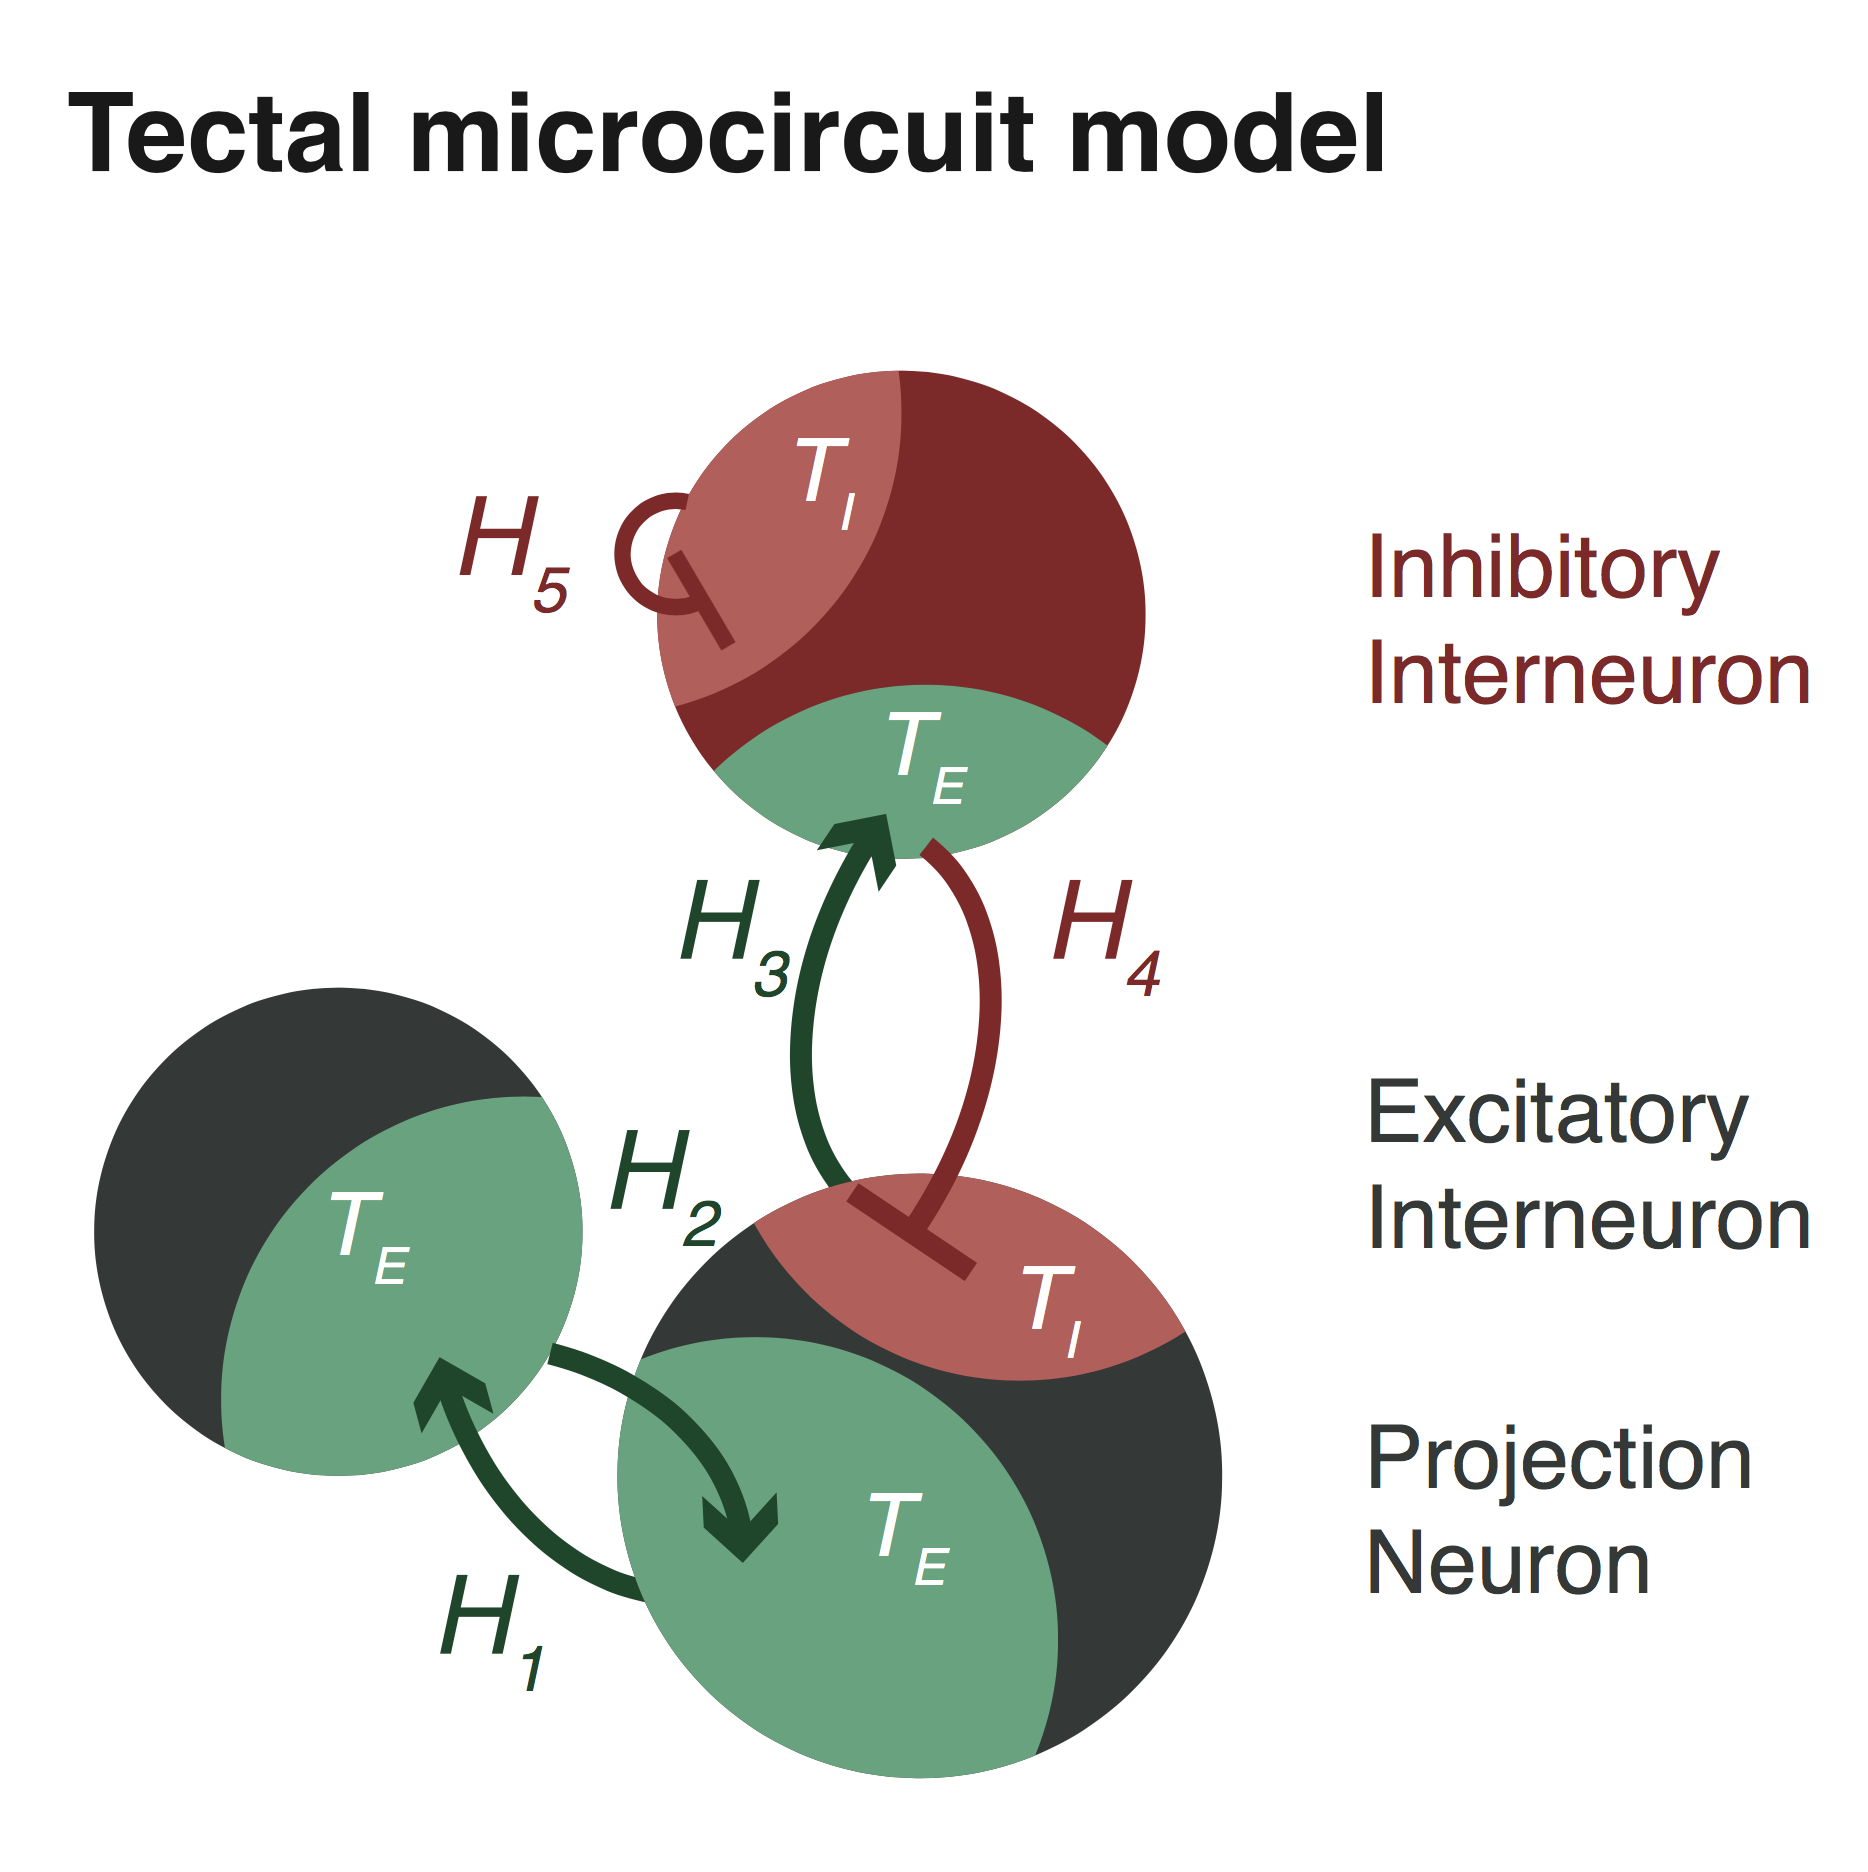
[Center Right] For each cursor position, the model parameters are also plotted. Note that the time constants vary smoothyl along the x-dimension, whilst the intrinsic connections vary along the y-dimension. [Bottom Right] Parameters represent particular neuronal population coupling features for a neural mass model of tectal coupling: time constants T describe the speed of a neuronal response to stimulation, whilst connection strengths H describe the influence of one population over another. |